Portfolio delivery intelligence
Portfolio Command Centre
“Across all our projects and service lines, what is at risk and where is the workload landing?”
3 report pages · select a frame to view it
What it shows
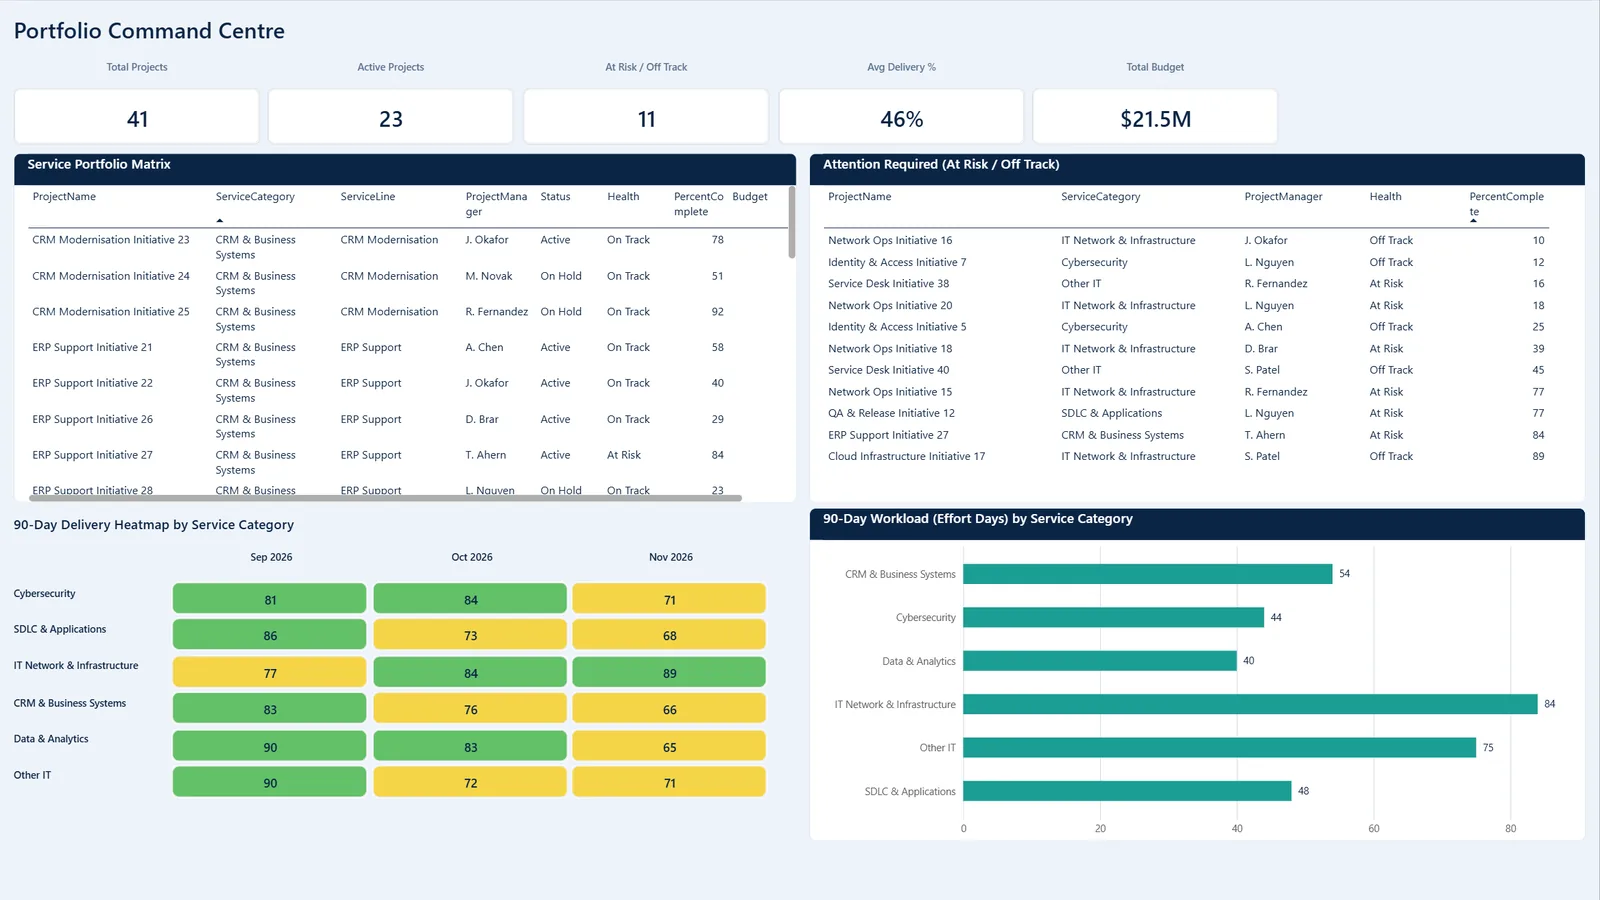
- Total, active and at-risk projects, delivery percentage and budget.
- A service portfolio matrix and an attention-required list for off-track work.
- A 90-day delivery heatmap and workload in effort days by service category.
- A service line explorer for drill-down, and resource allocation against constraints.
Outcomes
- One portfolio view without forcing teams onto one tool.
- Earlier warning on off-track projects.
- Capacity conversations grounded in effort data.
Built for: PMO leads and portfolio managers whose work is split across several tools and teams.
Product specification
Three report pages: Portfolio Command Centre, Service Line & Project Explorer, and Resource Allocation & Constraints.
A canonical schema is designed to take exports from Jira, ServiceNow, Microsoft 365 and portfolio tools, so each team keeps its own tool. The heatmap spreads effort days across the next 90 days by service category, and resource allocation compares that demand with available capacity.
- Pages
- 3
- Window
- Next 90 days
- Sources
- Jira, ServiceNow, M365 exports
- Format
- Power BI (PBIP)
How it's delivered: days, not months
- ScopeA short call to agree the decision it needs to support and which data you already have.
- LoadYour exports go into the model's CSV templates. No live connection to your systems is needed to start.
- RunThe model runs on your data, and every number traces back to its inputs and the documented method.
- Hand overYou keep the Power BI file, its design walkthrough and engineering companion, or our practitioners run it with you each month.
See Portfolio Command Centre running on your own data.