AI governance forecast
AI Future
“Is AI threat sprawl outpacing governance?”
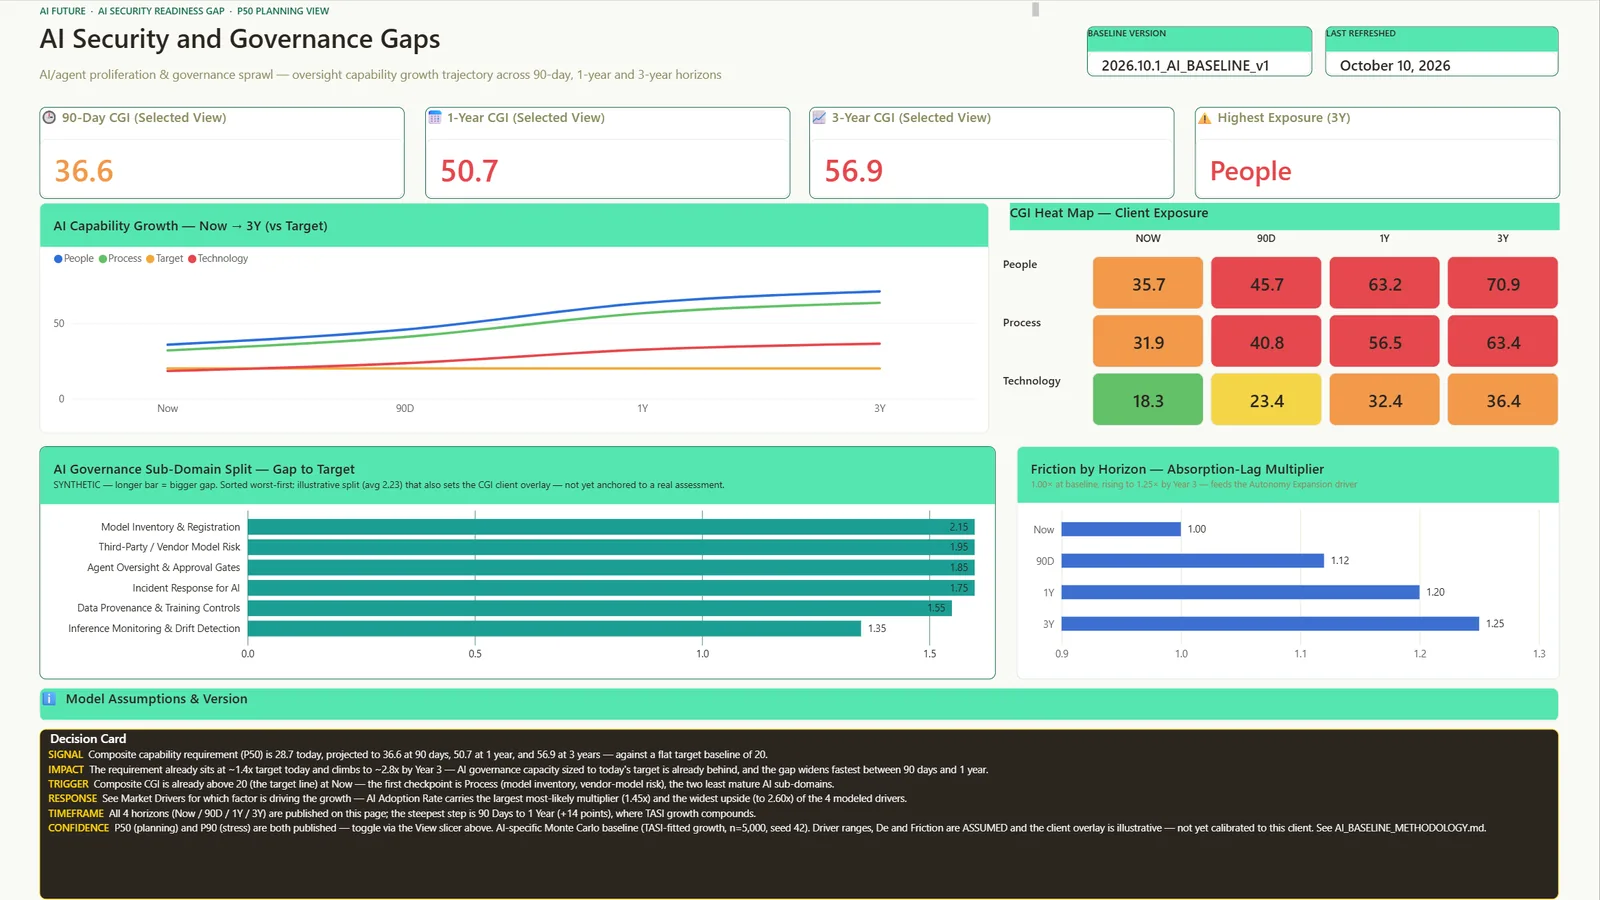
4 report pages · hover to hold, select a frame to view it
What it shows
- AI security and governance gaps by pillar, now and at each horizon.
- AI adoption velocity from public telemetry, quarter on quarter.
- The market drivers behind the forecast and how much each one contributes.
- A projected AI investment curve: the effort and spend needed to keep pace.
Outcomes
- A dated estimate of when AI sprawl crosses your governance threshold.
- The people effort and incremental investment needed, as a range.
- Recommended governance themes tied to the gaps they close.
Built for: CISOs, chief data officers and AI governance boards.
Product specification
Four report pages: AI Security and Governance Gaps, AI Adoption Velocity, Market Drivers, and Projected AI Investment Curve.
An AI threat and tooling adoption sprawl index combines public vulnerability data (CISA KEV, NVD, CVSS) with open-source AI adoption signals. Forecasts run as ranges, with full-time-equivalent effort and incremental investment shown at P50 and P90.
- Pages
- 4
- Signals
- Vulnerability + AI adoption telemetry
- Output
- FTE effort and investment, P50 / P90
- Format
- Power BI (PBIP)
How it's delivered: days, not months
- ScopeA short call to agree the decision it needs to support and which data you already have.
- LoadYour exports go into the model's CSV templates. No live connection to your systems is needed to start.
- RunThe model runs on your data, and every number traces back to its inputs and the documented method.
- Hand overYou keep the Power BI file, its design walkthrough and engineering companion, or our practitioners run it with you each month.
See AI Future running on your own data.
More in Futures
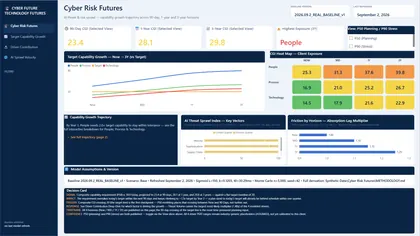 Cyber Future A forecast of the capability each pillar needs as the threat landscape grows.
 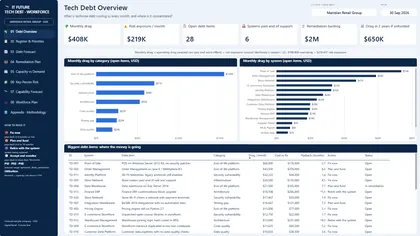 IT Future: Tech Debt The monthly cost of technical debt, a priority register, and what a given budget pays back.
 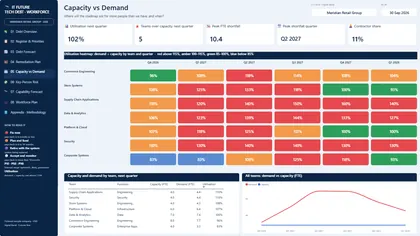 IT Future: Workforce & Capability Capacity against demand, key-person risk and the skills gap, with the cost of closing it.