Technical debt
IT Future: Tech Debt
“What is technical debt costing every month, and what should be fixed first?”
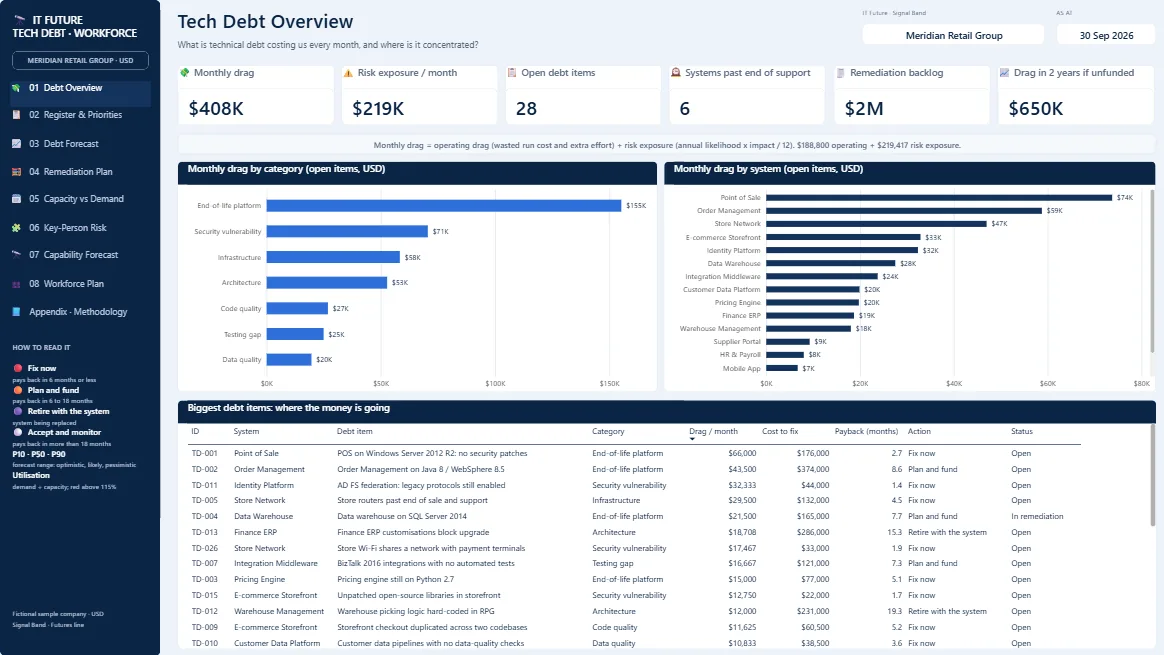
5 report pages · hover to hold, select a frame to view it
What it shows
- What technical debt costs every month, and where it is concentrated.
- A debt register ranked by cost to fix against monthly drag.
- Drag over 8 quarters, funded against unfunded, as P10 / P50 / P90 ranges.
- What a given budget funds, retires and pays back.
Outcomes
- Technical debt stated in dollars a month, not adjectives.
- A fix-first list the business can agree to.
- A remediation budget with its payback period attached.
Built for: CIOs, CTOs and finance partners deciding how much to invest in remediation.
Product specification
Four report pages plus a methodology appendix: Tech Debt Overview, Debt Register & Priorities, Debt Forecast, and Remediation Investment Plan.
Every figure is in dollars per month. Risk exposure is annual likelihood times impact divided by 12, with both inputs visible on the register. Drag is forecast over 8 quarters with a Monte Carlo simulation, funded and unfunded, and the investment plan shows what a chosen budget retires and how fast it pays back.
- Pages
- 4 + appendix
- Units
- USD per month
- Forecast
- 8 quarters, P10 / P50 / P90
- Format
- Power BI (PBIP), CSV inputs
How it's delivered: days, not months
- ScopeA short call to agree the decision it needs to support and which data you already have.
- LoadYour exports go into the model's CSV templates. No live connection to your systems is needed to start.
- RunThe model runs on your data, and every number traces back to its inputs and the documented method.
- Hand overYou keep the Power BI file, its design walkthrough and engineering companion, or our practitioners run it with you each month.
See IT Future: Tech Debt running on your own data.
More in Futures
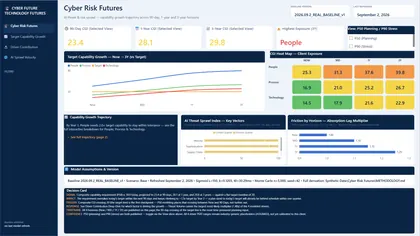 Cyber Future A forecast of the capability each pillar needs as the threat landscape grows.
 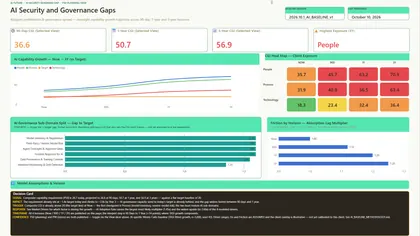 AI Future How fast AI adoption and AI-related threats are growing against the governance you have.
 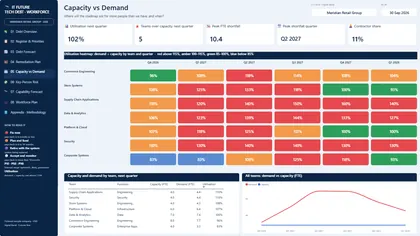 IT Future: Workforce & Capability Capacity against demand, key-person risk and the skills gap, with the cost of closing it.